Build a dashboard and run the simulation.
Create a first dashboard canvas and add the controls you need to make a simulation visible and interactive.
- Create a canvas from the Project explorer.
- Add a textbox, a button and an LED in the visual editor.
Create a canvas with three widgets
This example builds a small control row in a new canvas. It uses the same editor workflow for every widget: enter edit mode, then drag the widget from the palette onto the grid.
Add a new Canvas
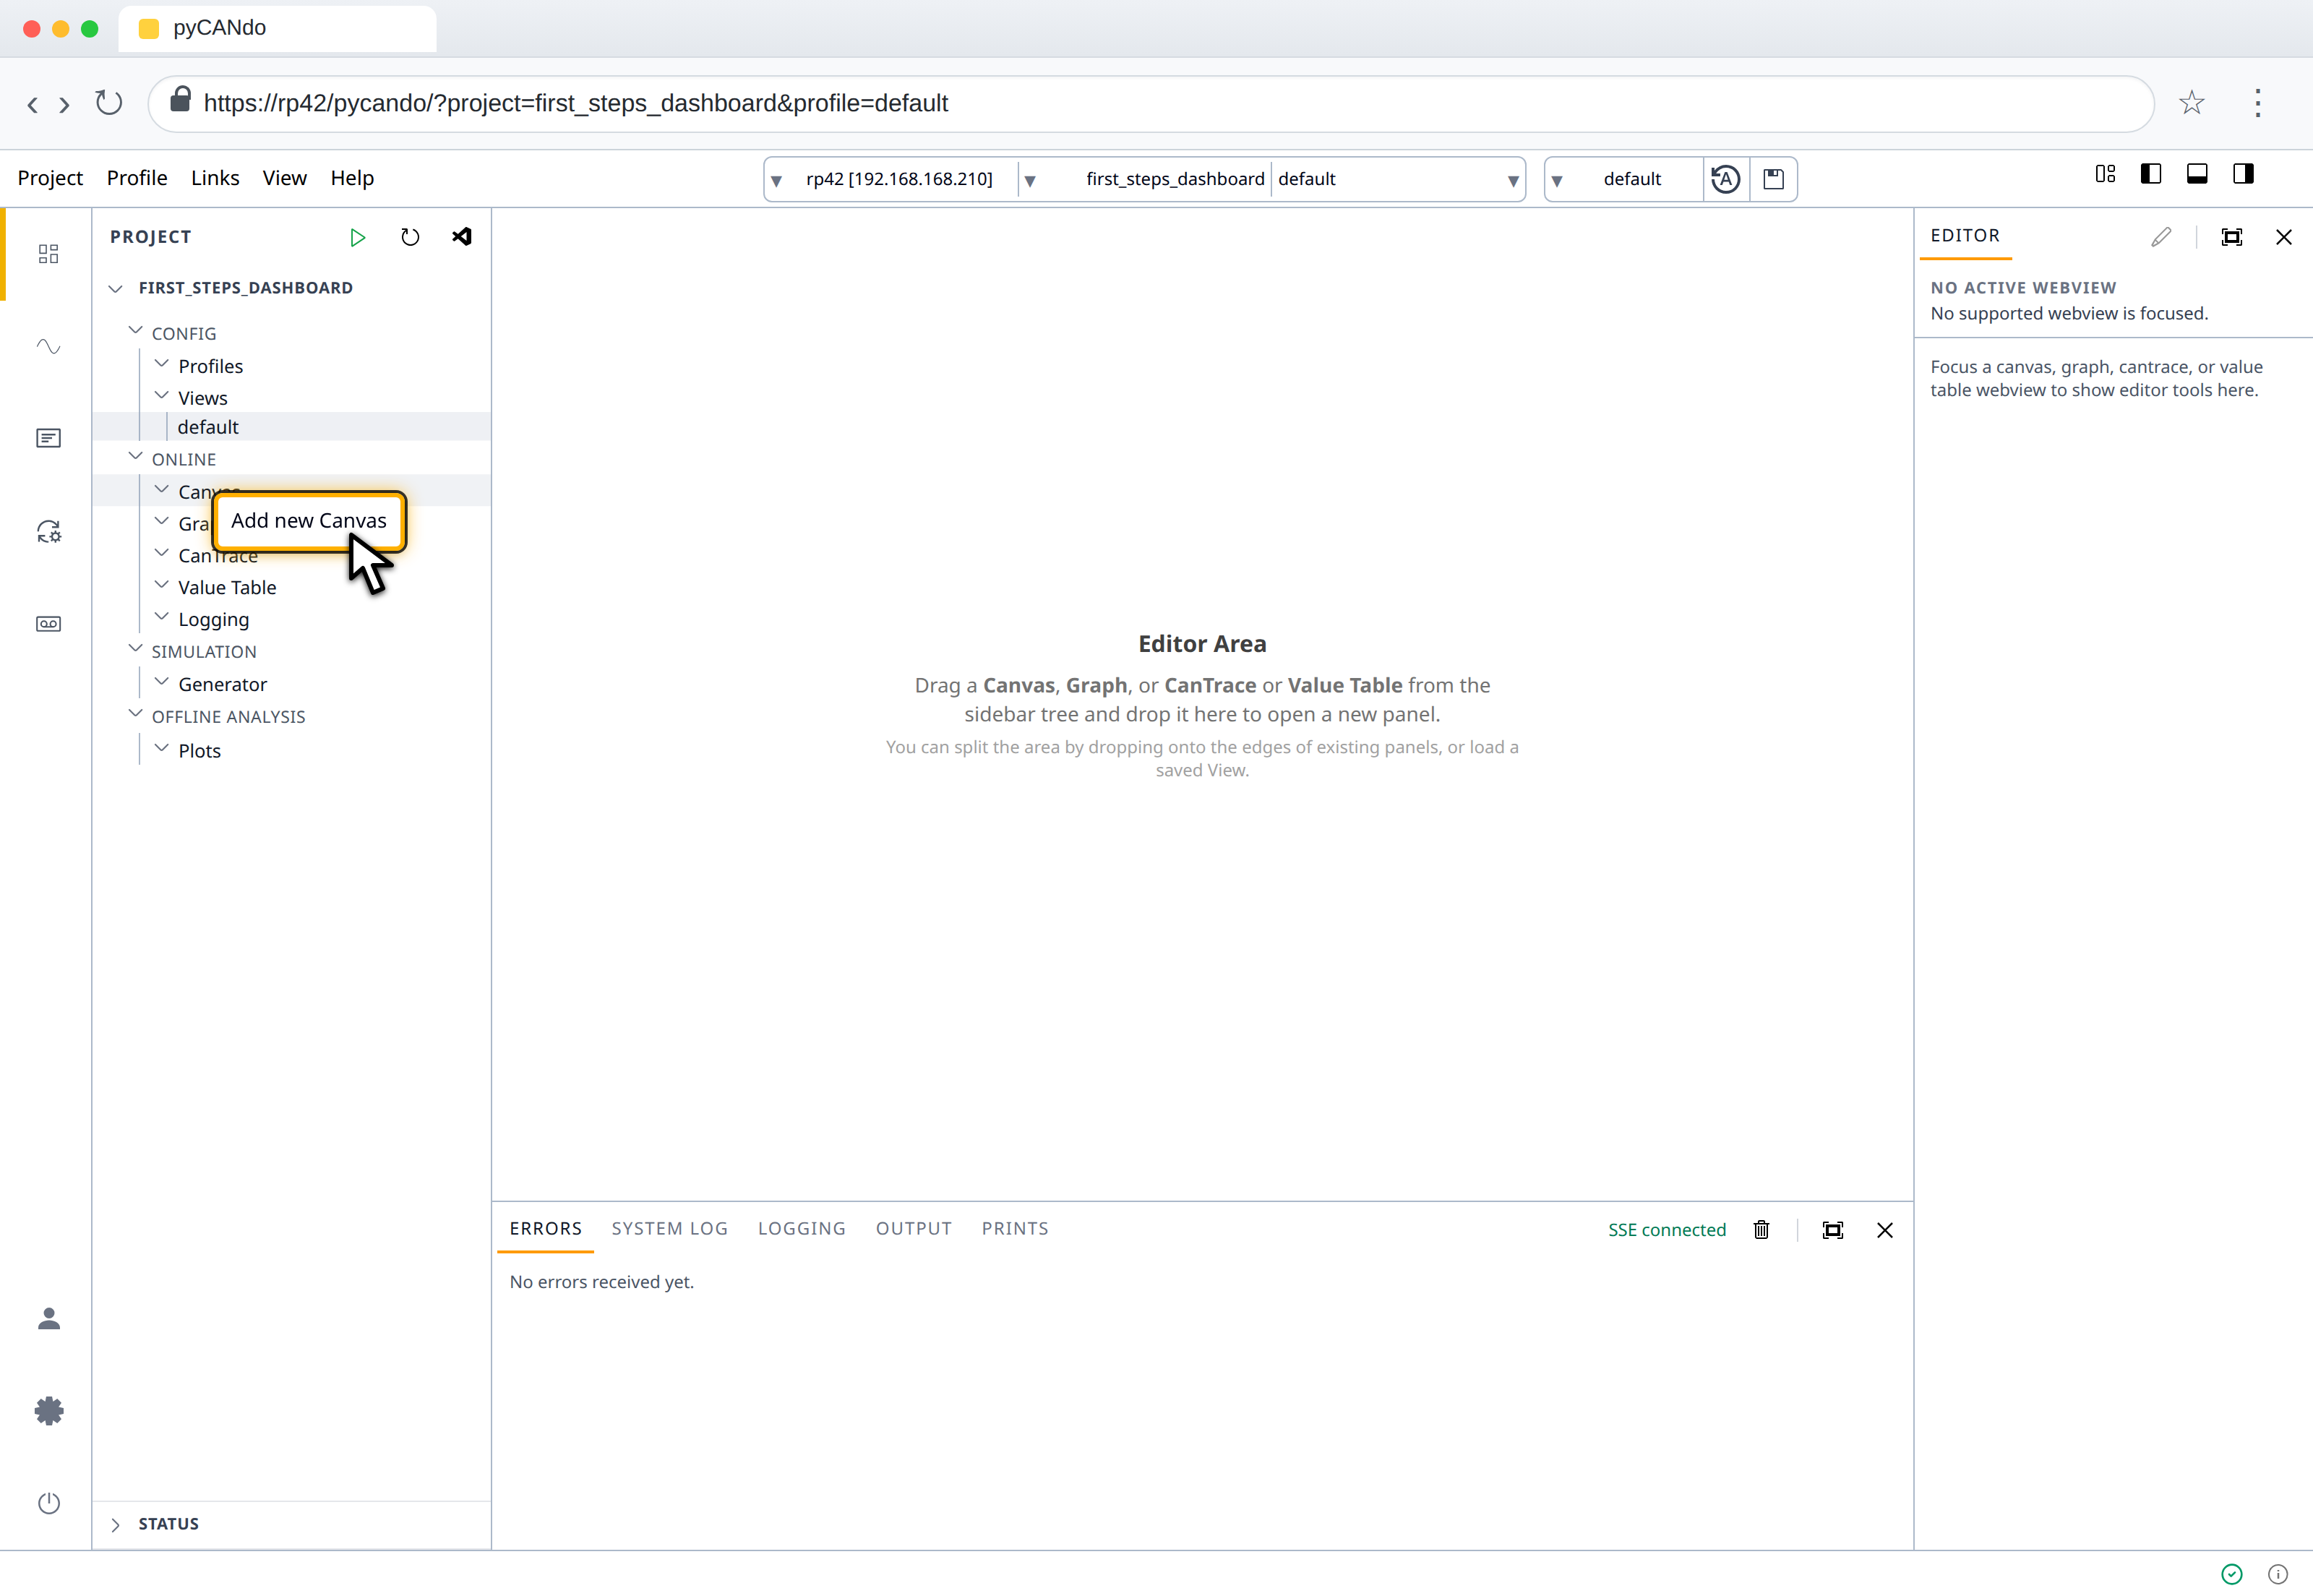
In the Project explorer, open the `Online` group, right-click `Canvas` and choose `Add new Canvas`.
Enter edit mode
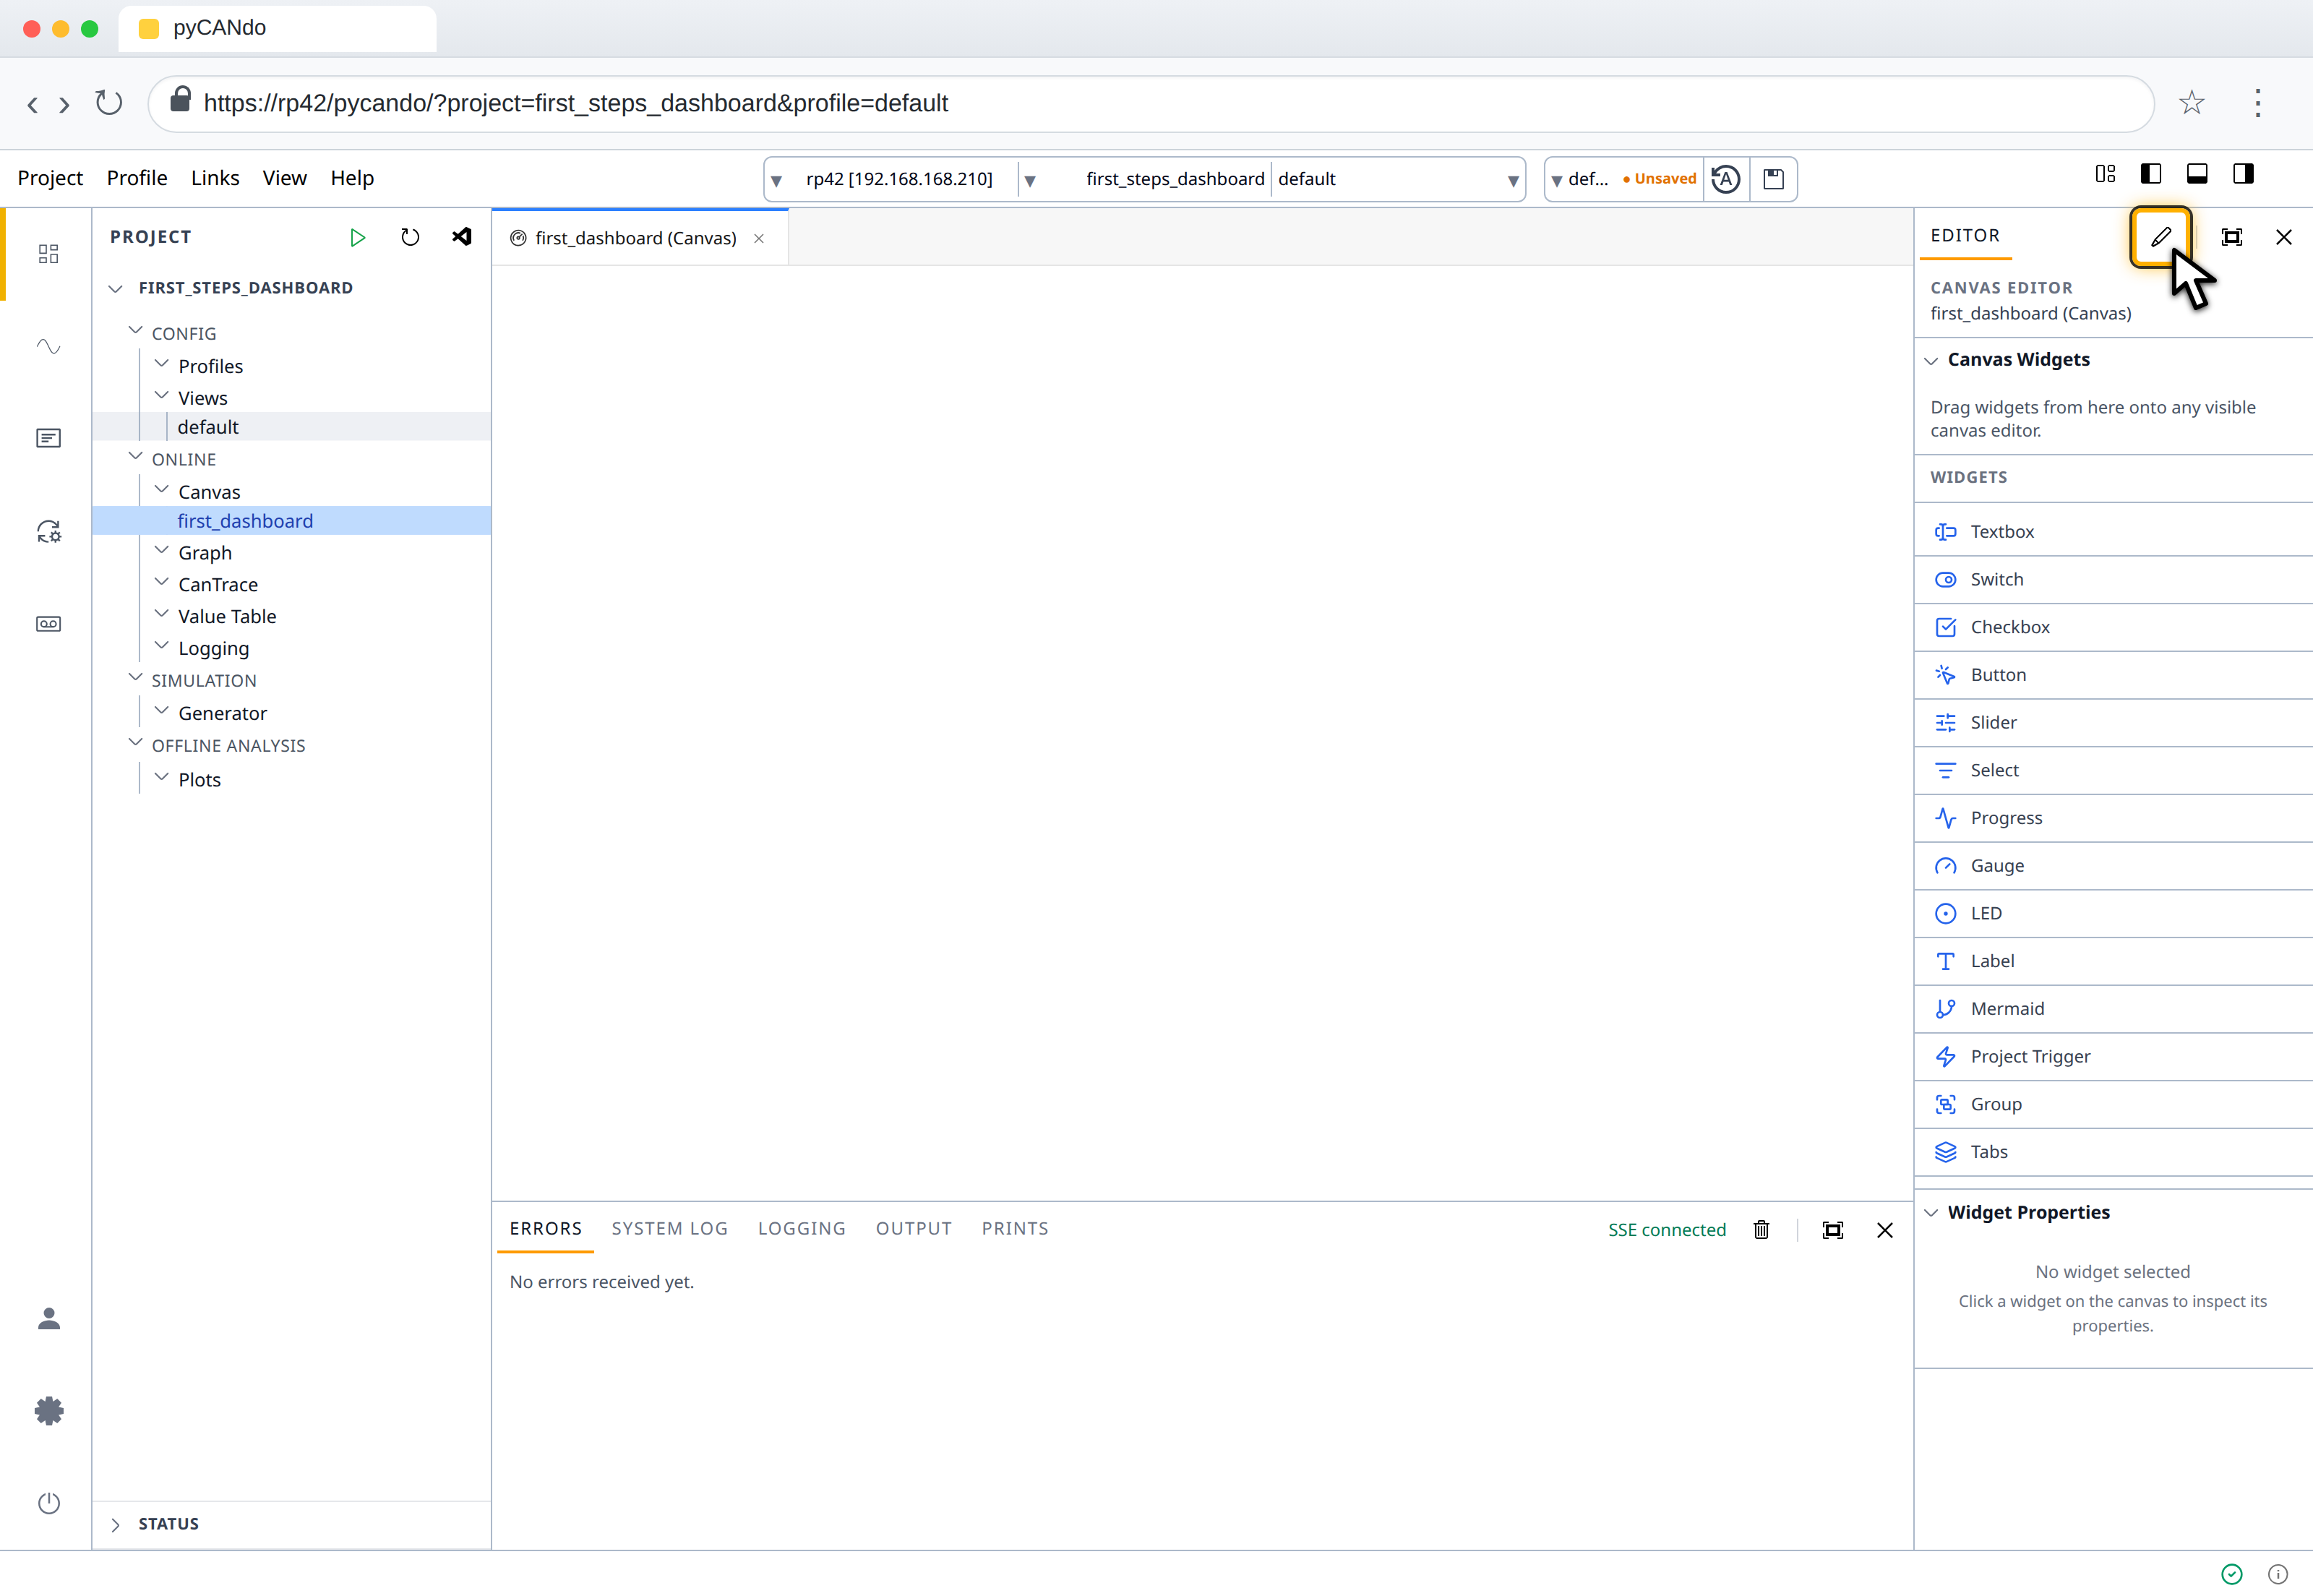
Open `first_dashboard` from the Canvas tree, then select the pencil in the Editor header. The canvas grid and the widget palette are now ready for editing.
Add the Textbox, Button and LED
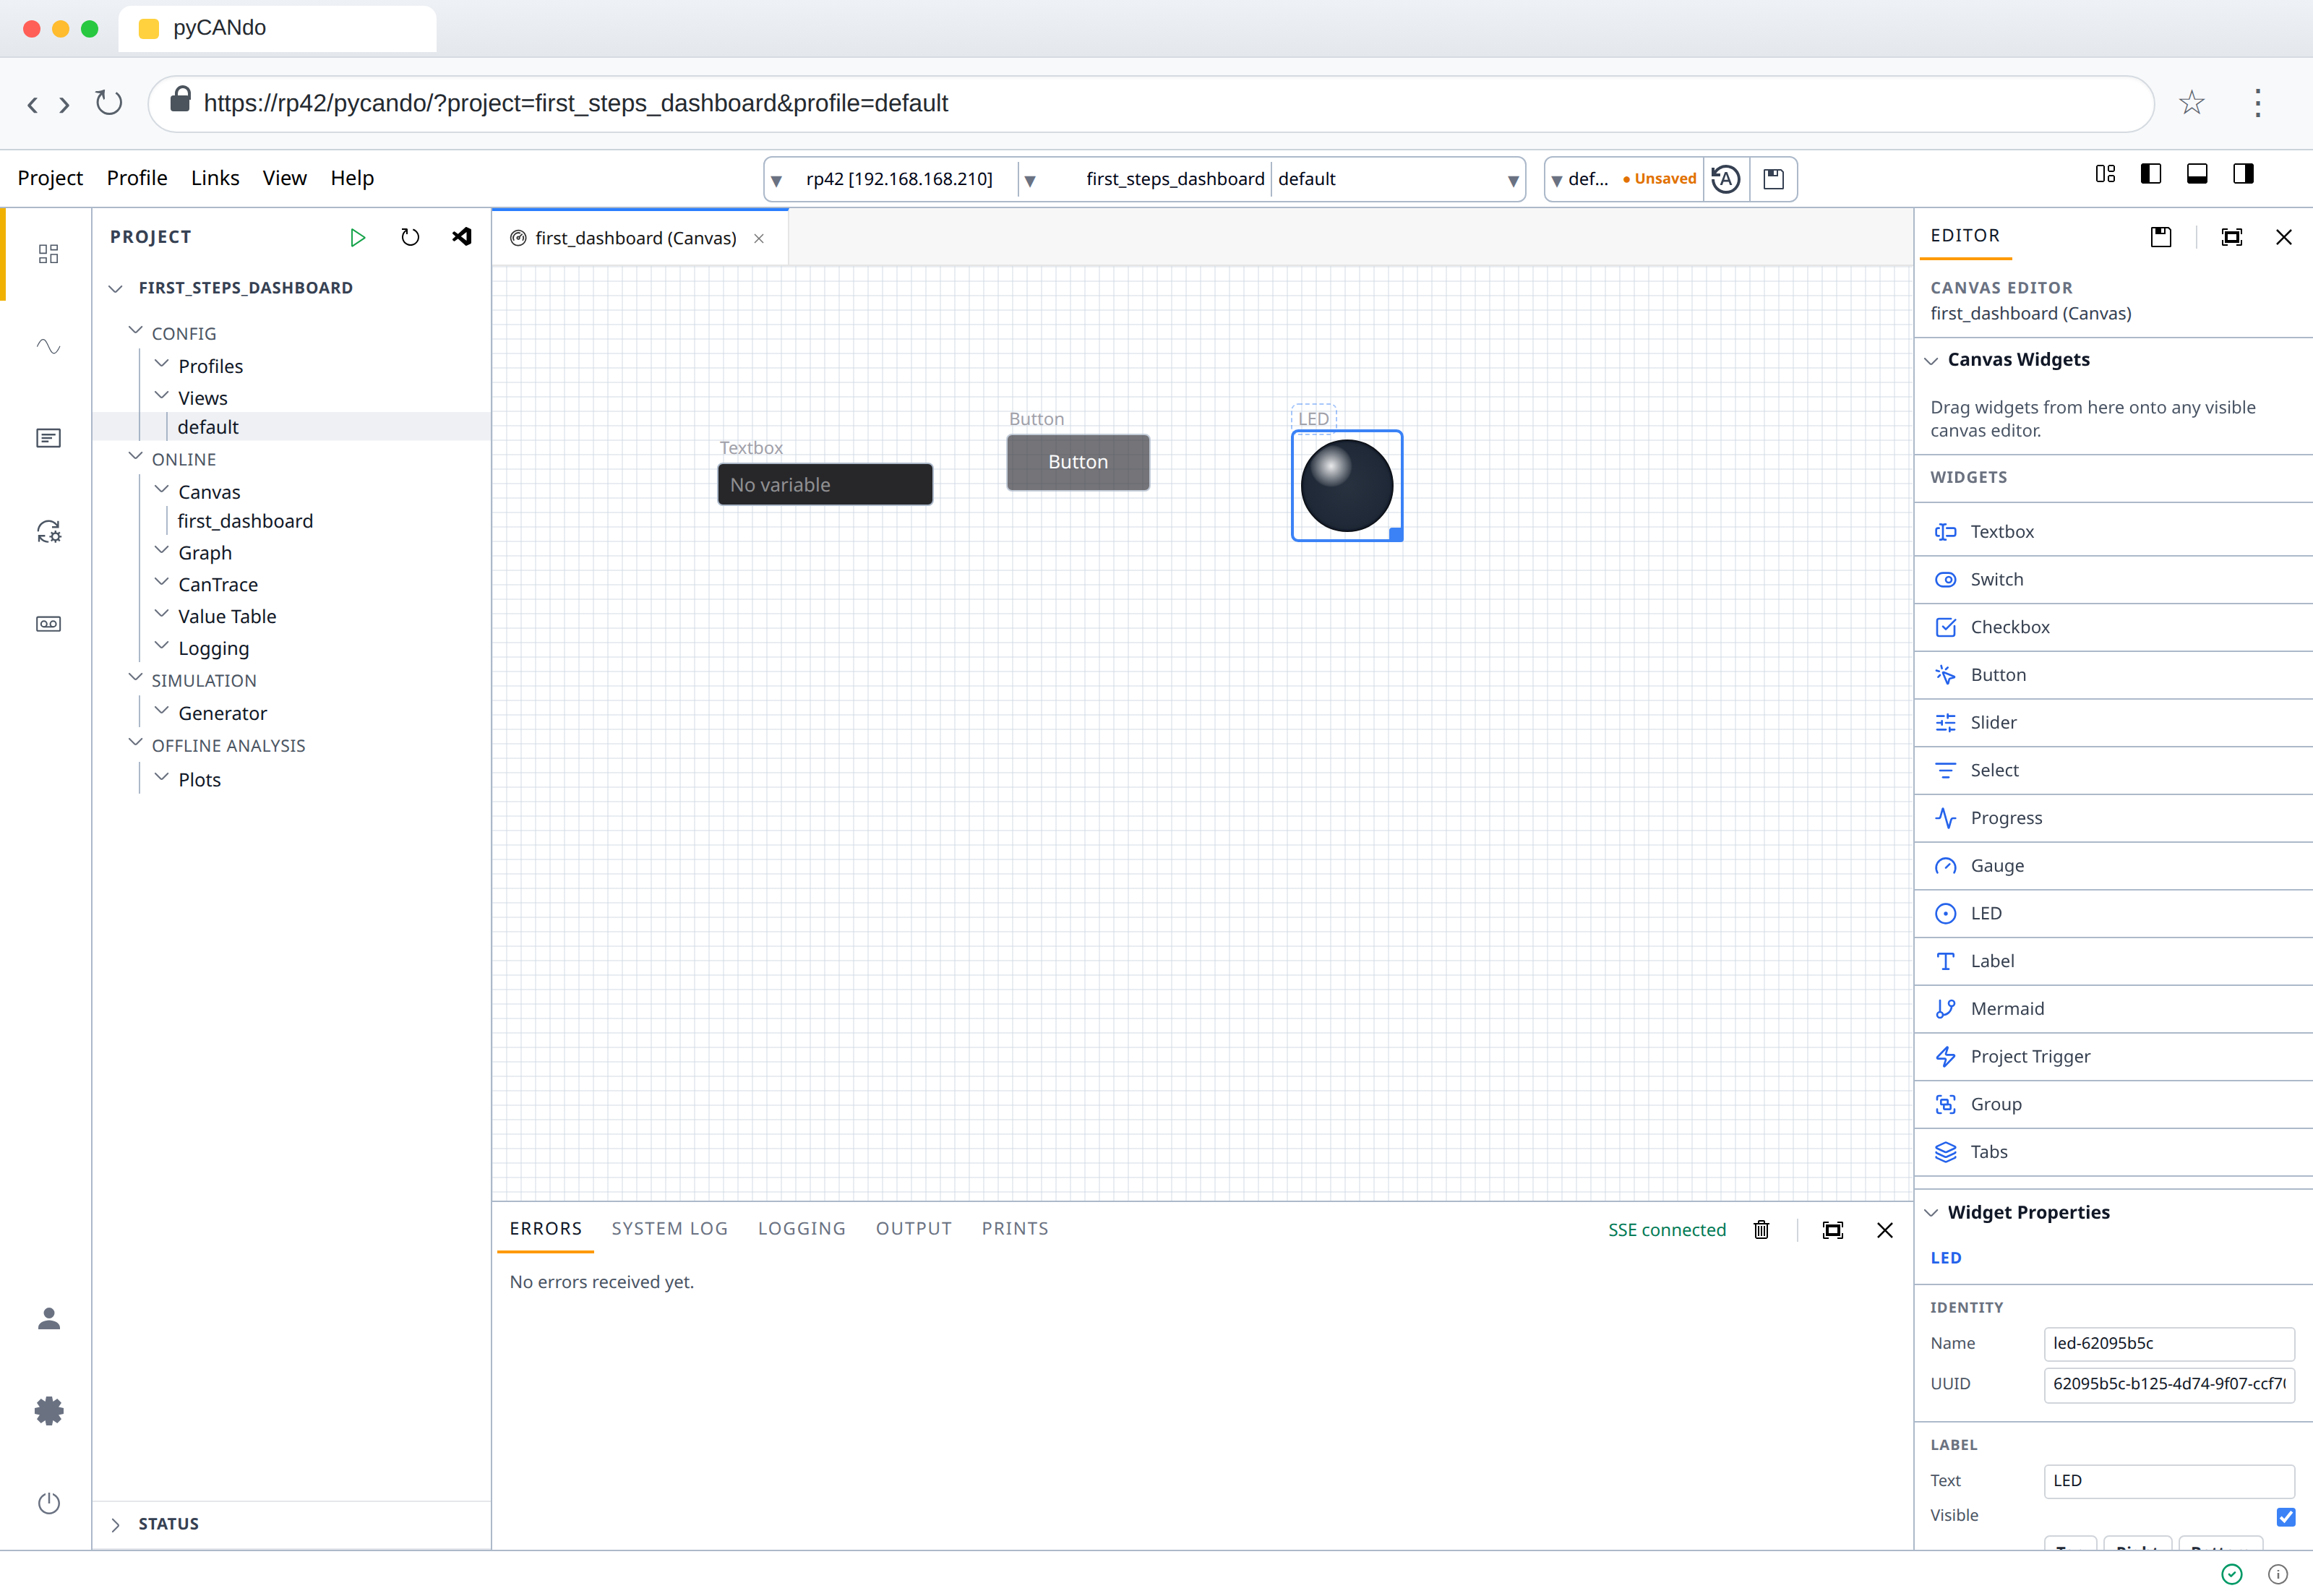
Drag `Textbox`, `Button` and `LED` from Canvas Widgets onto the grid and arrange them in a row.
Bind the LED to a sysvar
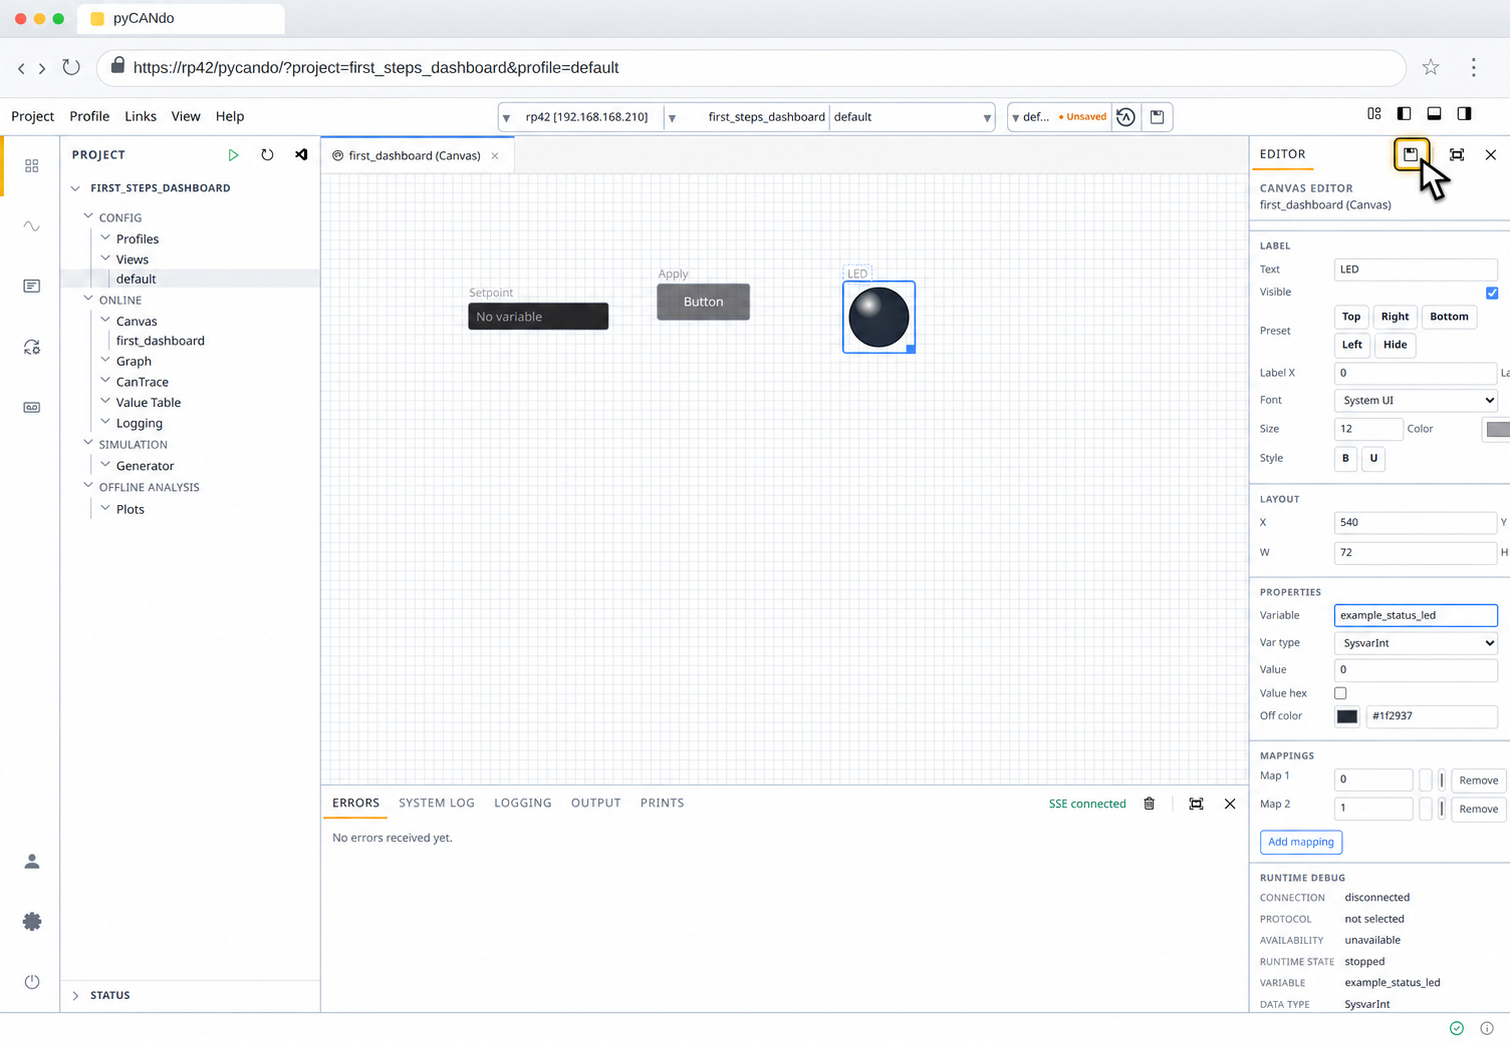
Name the Textbox `Setpoint` and the Button `Apply`. Select the LED, scroll to Widget Properties and enter `example_status_led` in `Variable`.
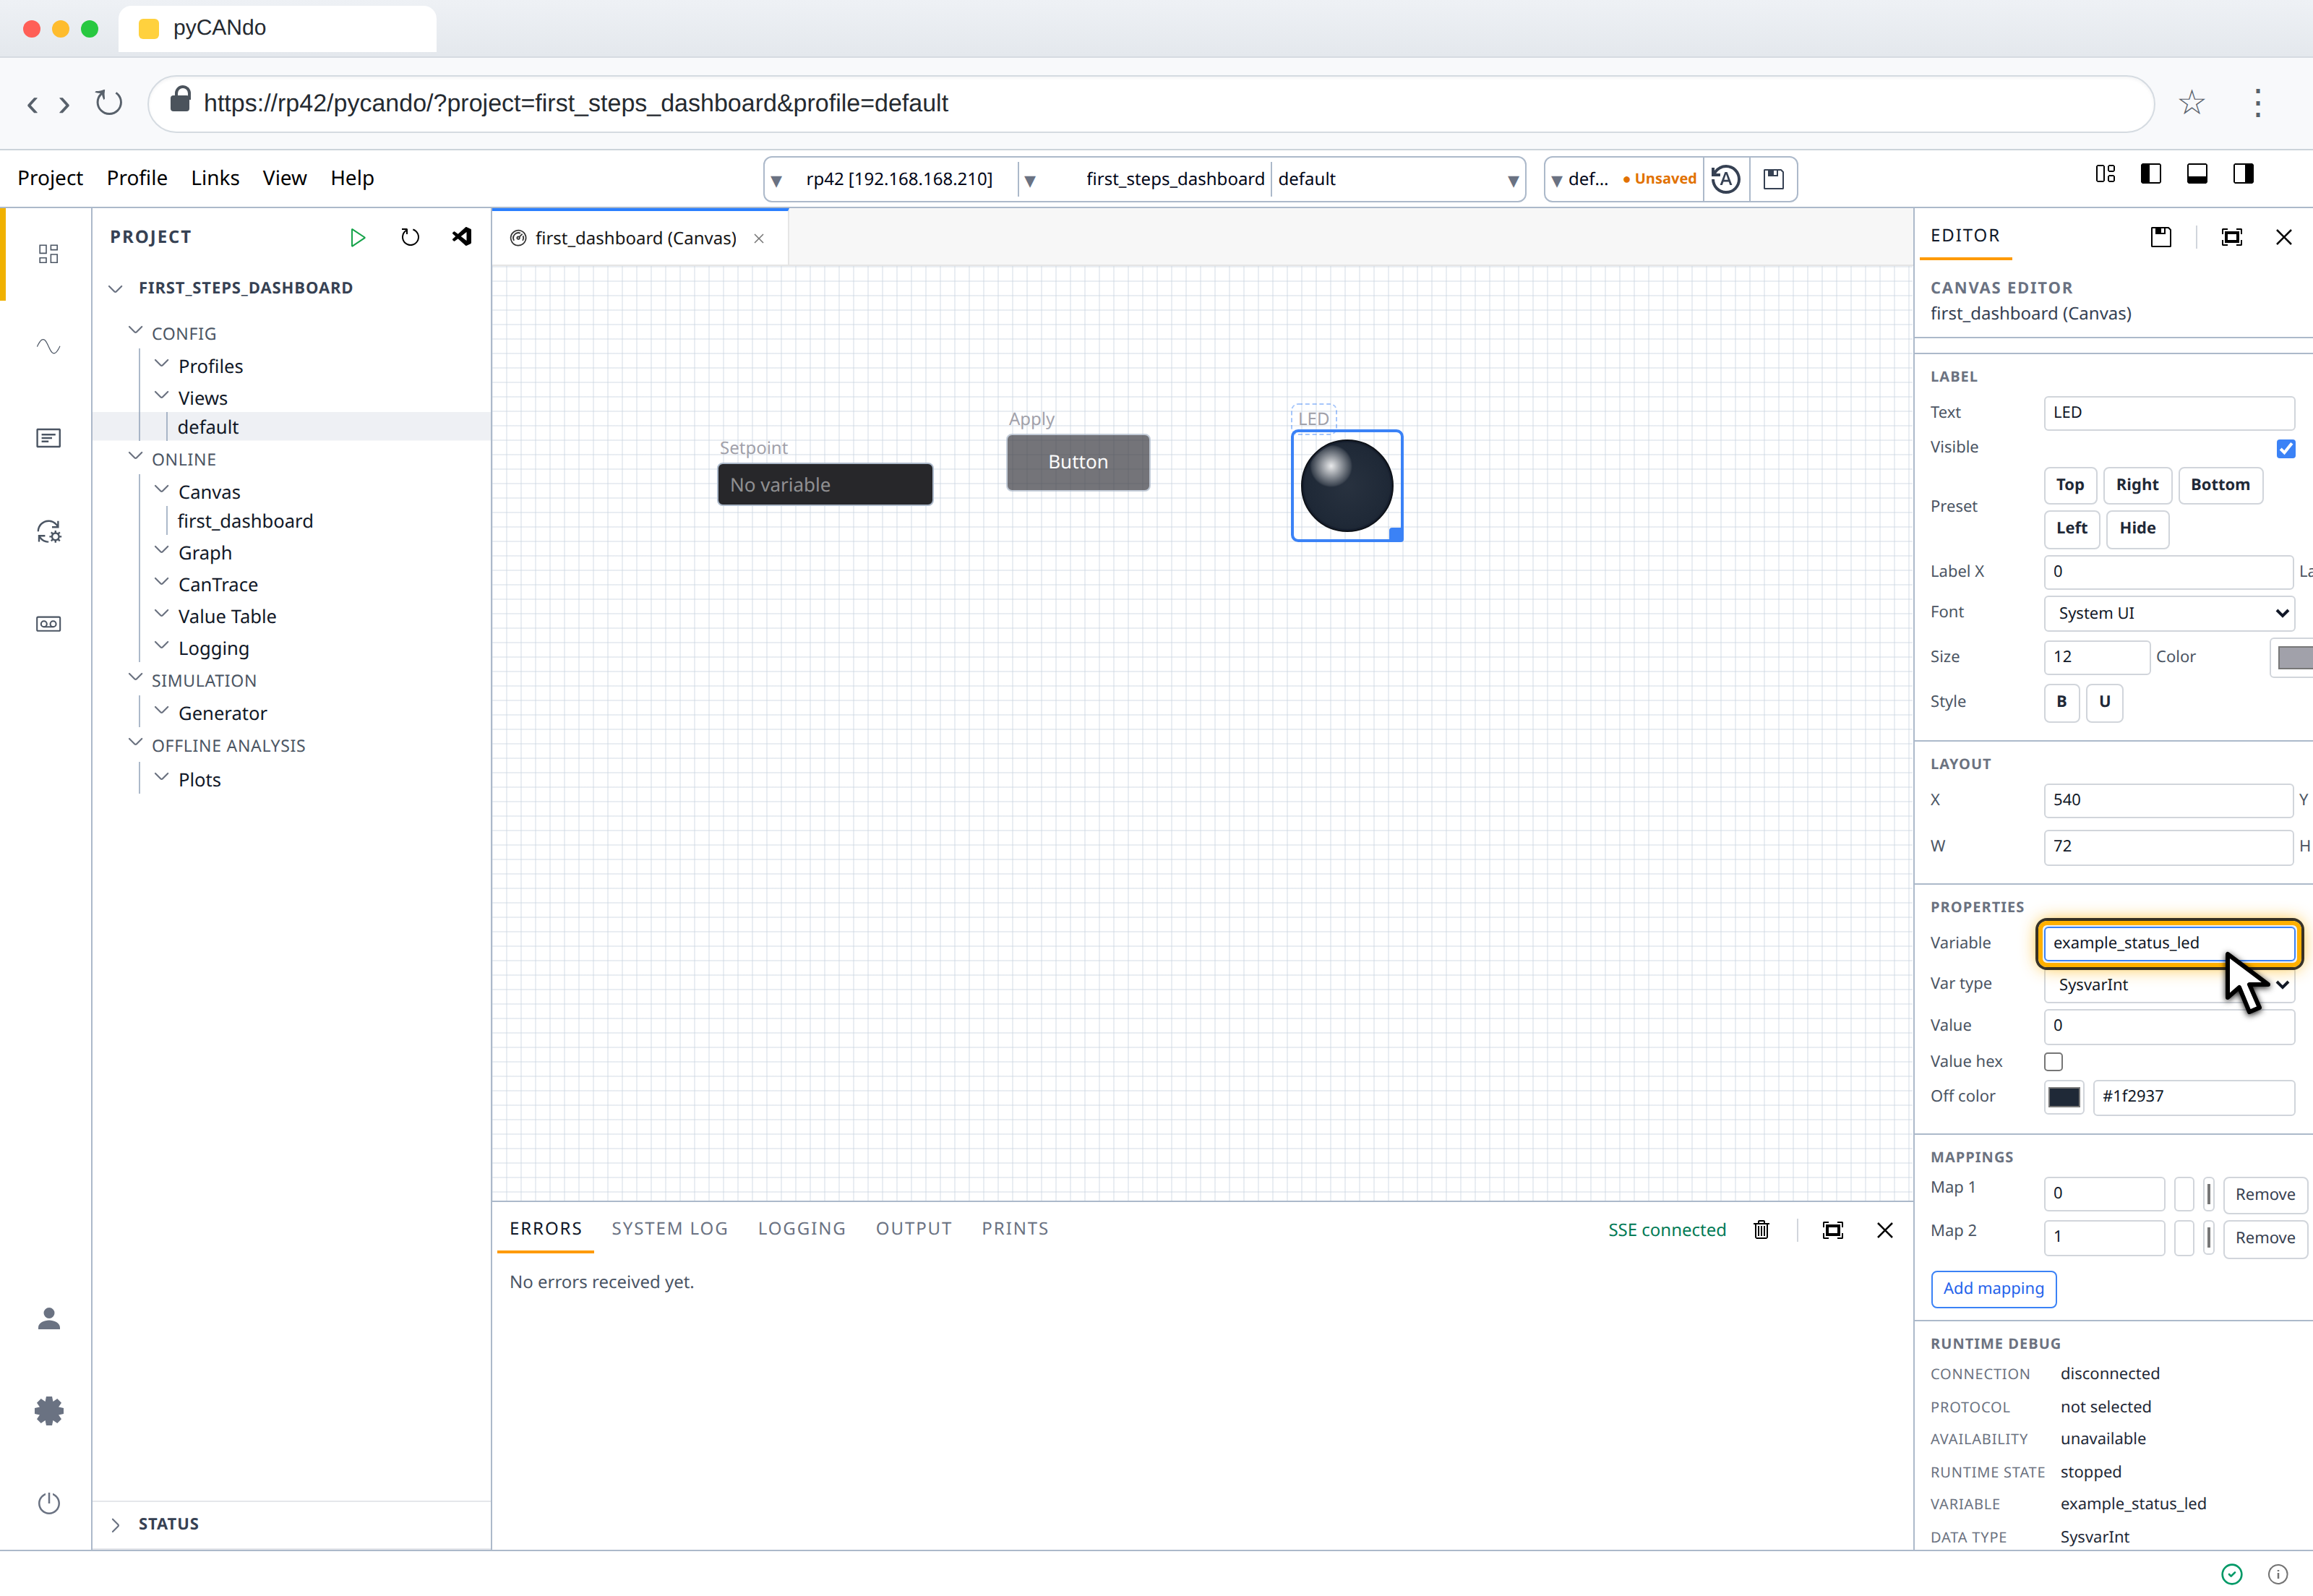
Save the dashboard
Select the save action in the Editor header to keep the canvas and leave edit mode.