
Live controls and values
Connect widgets to system variables to monitor state and change parameters while the project is running.
Build interactive browser views for monitoring and control, connect widgets to project variables, and share the result as a URL across your network.
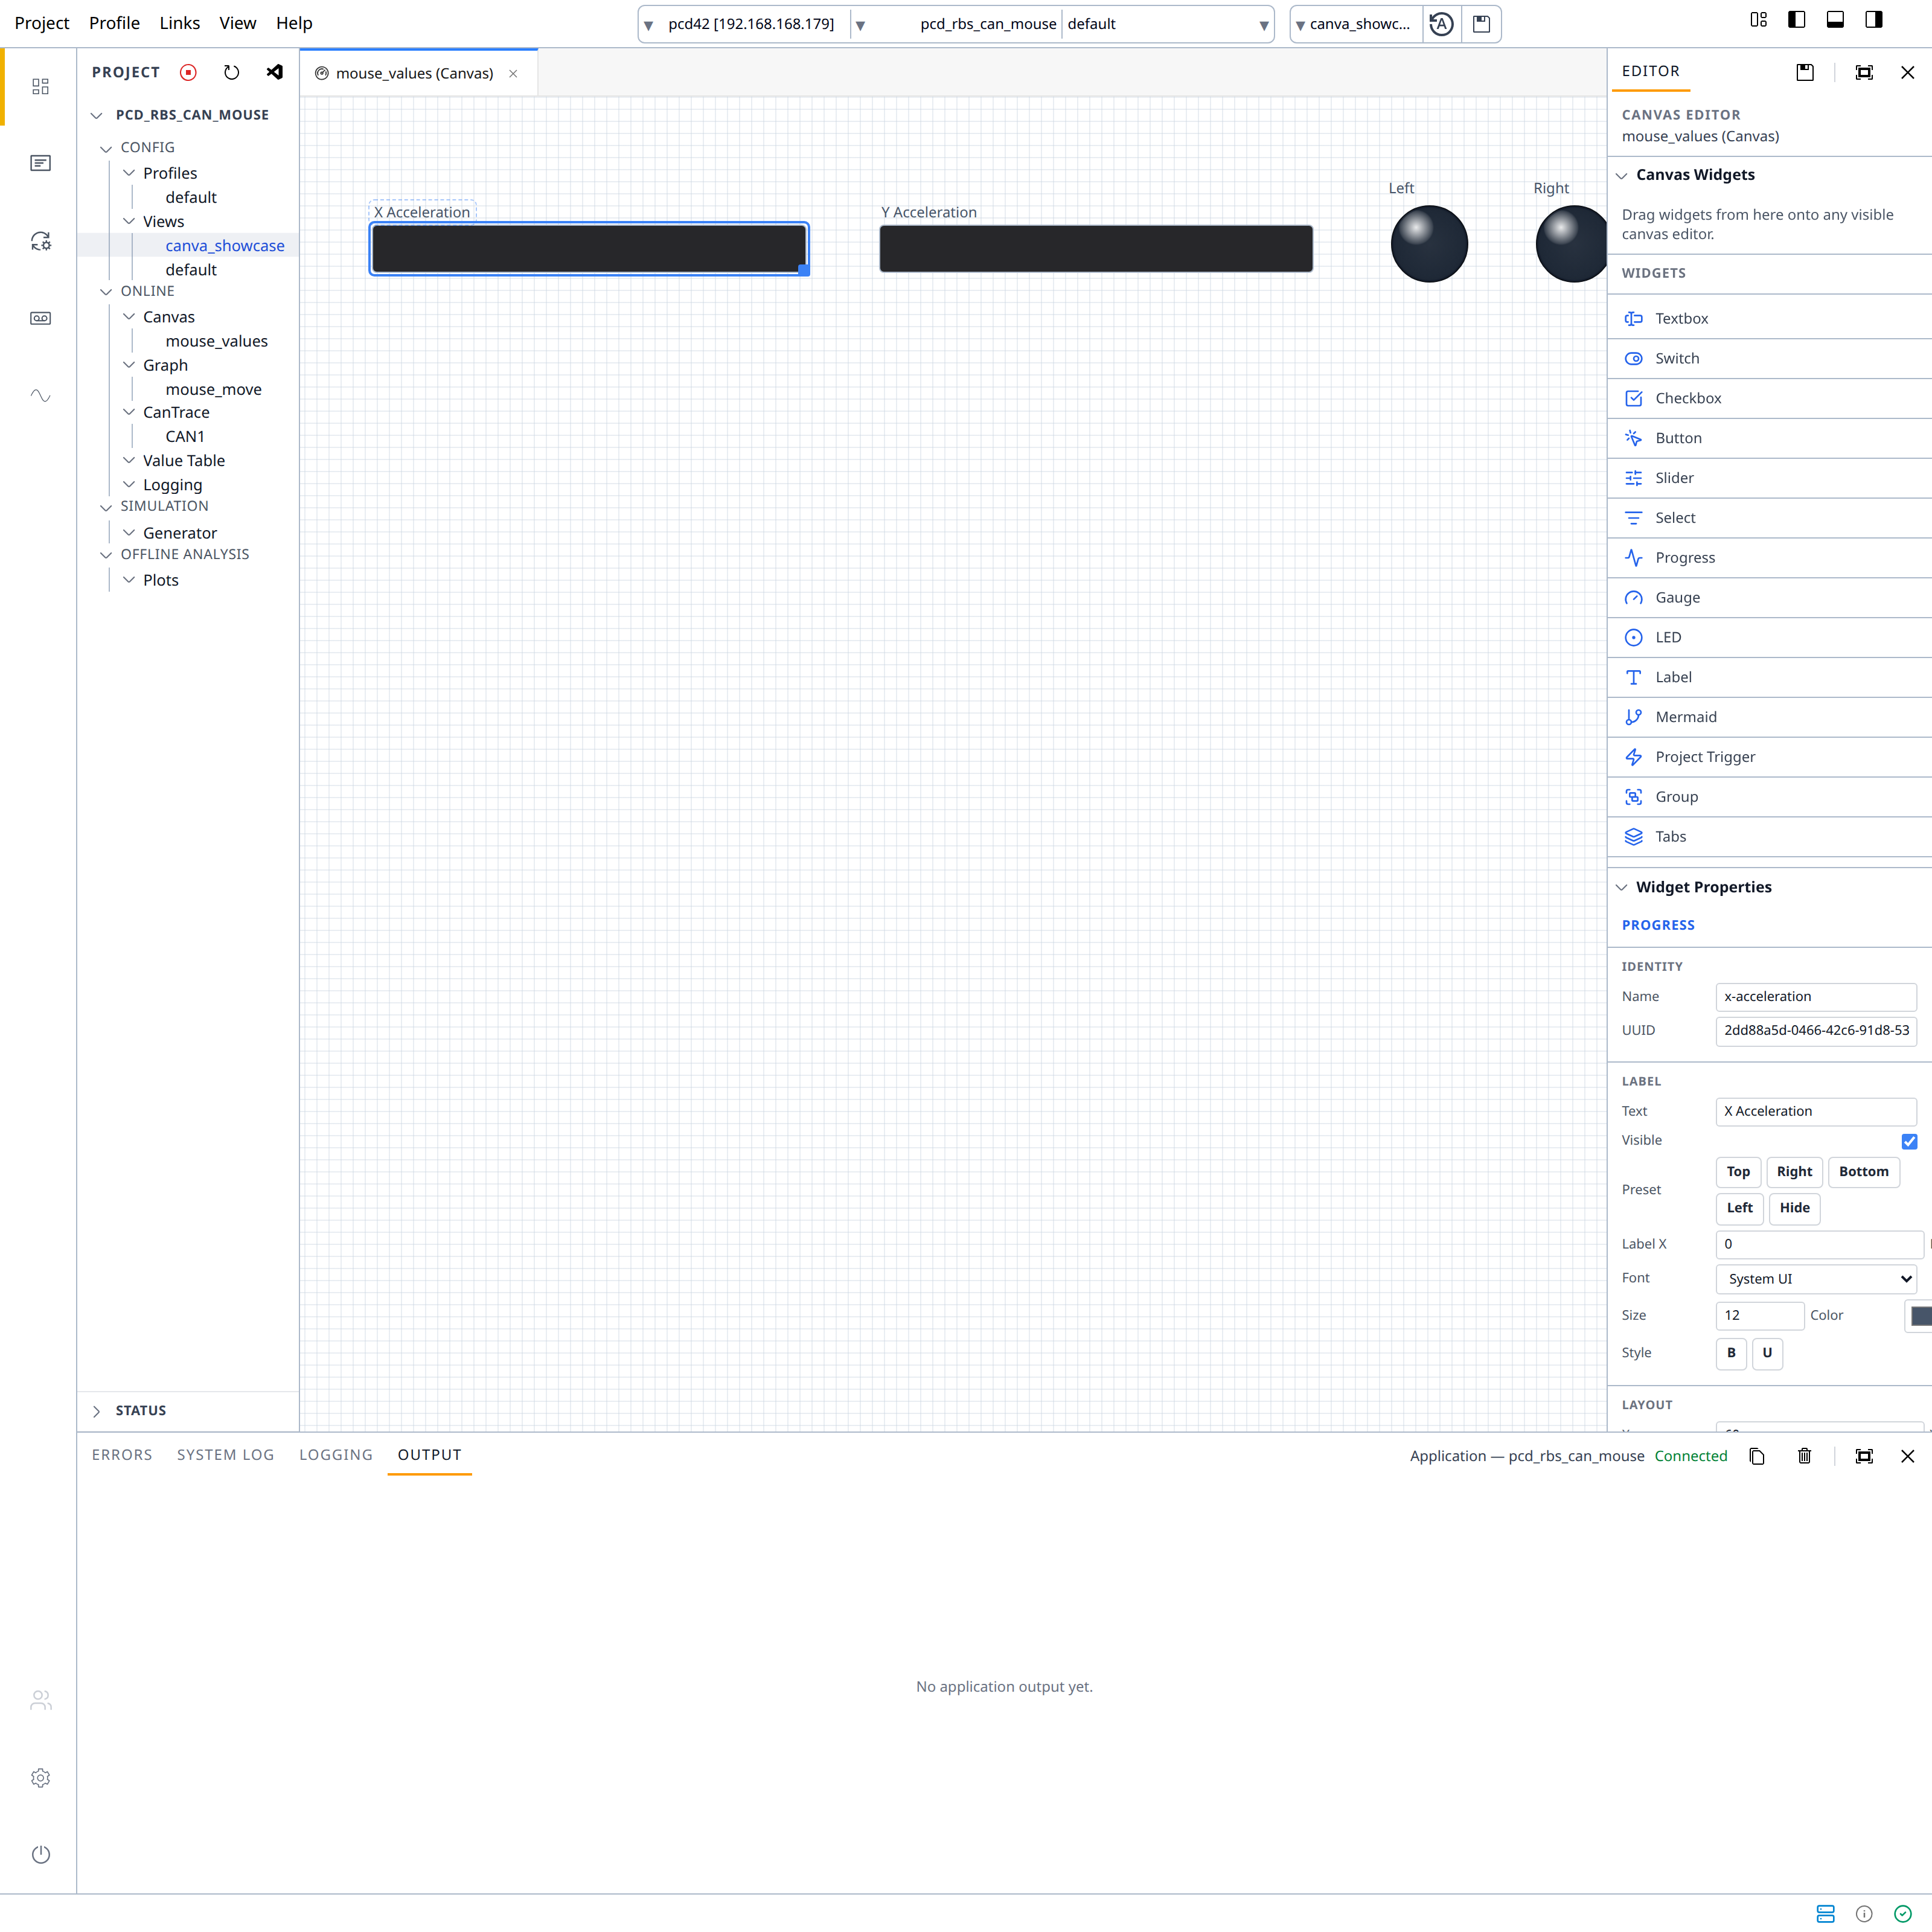
Combine controls, values, graphs, and CAN traces in a responsive canvas. Dashboard definitions are stored as JSON, making them easy to version, edit, reuse, and generate with AI-assisted workflows.
Connect widgets to system variables to monitor state and change parameters while the project is running.
Inspect time-series behavior and filtered bus traffic beside the controls that influence the test.
Open dashboards from a workstation, tablet, or phone without installing a separate desktop application.
Place controls, indicators, graphs, text, and CAN trace windows on a flexible canvas.
Assign system variables to widgets so the interface follows the live state of your simulation.
Store the dashboard with the project and give colleagues direct browser access through its URL.